
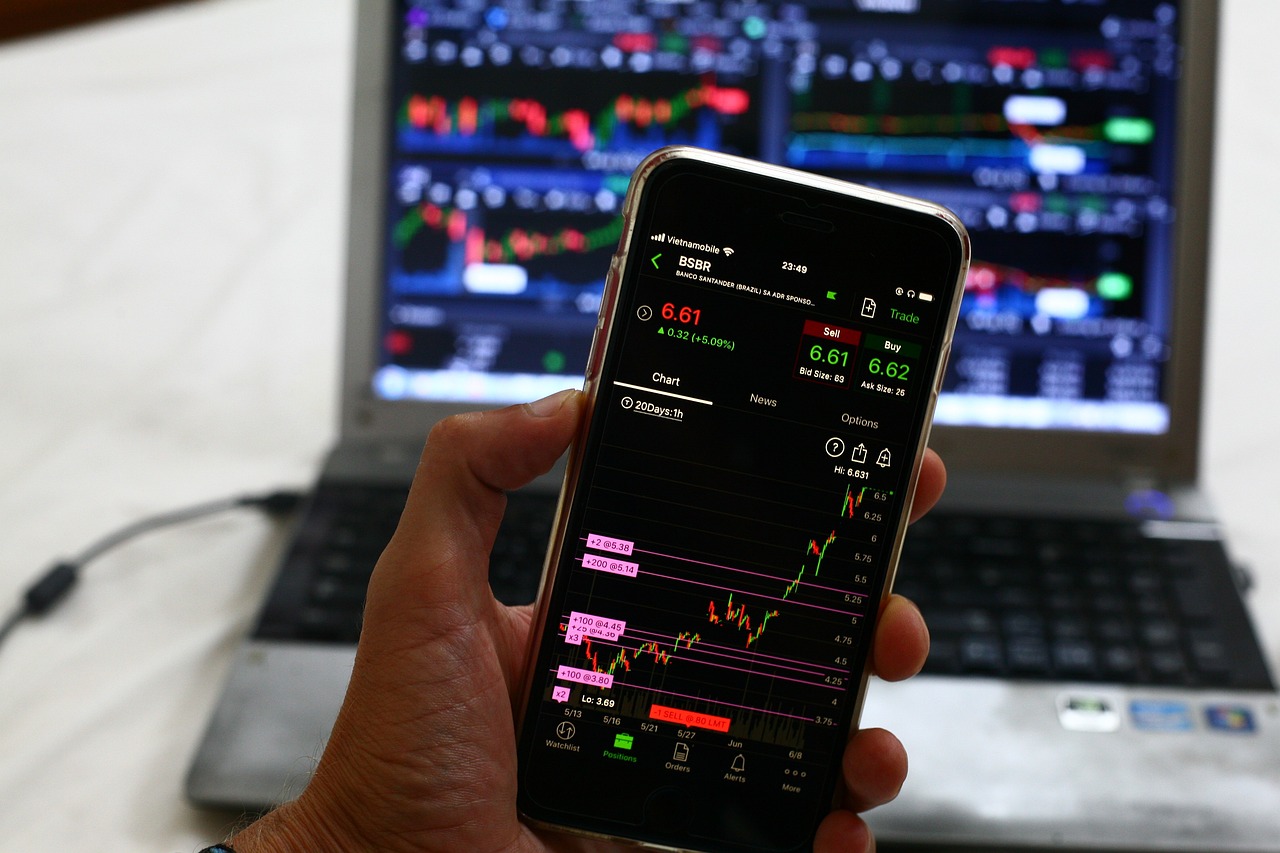
How to Identify Support and Resistance Levels in Bitcoin
Bitcoin trading can often feel like navigating a maze, where the walls are constantly shifting and the exit is never clearly marked. But fear not! Understanding the concepts of support and resistance can illuminate your path and empower your trading decisions. In this article, we’ll explore how to identify these crucial levels in Bitcoin, so you can trade with confidence and clarity.
Support and resistance are like the yin and yang of technical analysis. They represent price levels where the market tends to reverse direction. Support refers to a price level where buying interest is strong enough to overcome selling pressure, preventing the price from falling further. Think of it as a safety net that catches the price before it drops. On the flip side, resistance is where selling interest overcomes buying pressure, causing the price to stop rising. Imagine it as a ceiling that the price struggles to break through.
These levels are significant because they help traders make informed decisions. When the price approaches a support level, traders might see it as a buying opportunity, while resistance levels might signal a chance to sell. Understanding these dynamics can be the difference between a winning trade and a costly mistake.
Have you ever noticed how certain price levels seem to keep popping up in Bitcoin's history? That's because analyzing historical price levels can reveal potential support and resistance zones. By examining past price movements, traders can gain insights into where the market may react in the future. For instance, if Bitcoin has bounced off a certain price level multiple times, that level is likely to act as a support zone again.
To effectively analyze historical price levels, consider these key points:
- Look for price points where the market has reversed direction in the past.
- Identify areas with high trading volume, as these often coincide with strong support or resistance levels.
- Pay attention to psychological levels, such as whole numbers (e.g., $20,000), which can act as significant barriers.
Chart patterns are like the breadcrumbs left by Bitcoin's price movements, guiding traders toward potential support and resistance levels. Patterns such as double tops and double bottoms can indicate where these levels lie. A double top, for example, forms when the price hits a resistance level twice before reversing downward, signaling that sellers are stepping in. Conversely, a double bottom occurs when the price hits a support level twice before bouncing back up, indicating strong buying interest.
Drawing trendlines is another effective way to visualize support and resistance levels. By connecting the highs and lows of Bitcoin's price movements, traders can identify potential reversal points. An upward trendline acts as a support level, while a downward trendline serves as a resistance level. The beauty of trendlines lies in their ability to adapt to changing market conditions, providing a dynamic perspective on price action.
Moving averages are like the smooth operators of the trading world, helping to filter out the noise and identify trends. They can serve as dynamic support and resistance levels. For example, the 50-day moving average often acts as a support level during bullish trends, while the 200-day moving average can serve as a resistance level in bearish trends. By observing how the price interacts with these moving averages, traders can make more informed decisions.
Volume is the lifeblood of any market, and it plays a critical role in confirming support and resistance levels. When a price level is approached with high trading volume, it adds credibility to that level. For instance, if Bitcoin approaches a support level with a surge in volume, it suggests strong buying interest, increasing the likelihood that the price will bounce back. Conversely, if the price hits a resistance level with low volume, it may indicate a lack of conviction in the selling pressure, potentially leading to a breakout.
In the world of Bitcoin trading, various technical indicators can assist in identifying support and resistance levels. These tools can enhance your analysis and provide additional confirmation for your trading decisions. Some popular indicators include:
- Fibonacci Retracement: This tool helps identify potential support and resistance levels based on the Fibonacci sequence, guiding traders toward key price retracement levels.
- Pivot Points: These provide a systematic approach to determine support and resistance levels based on previous price action, offering valuable insights for day trading strategies.
The Fibonacci retracement tool is a favorite among traders for identifying potential support and resistance levels. By plotting key Fibonacci levels (23.6%, 38.2%, 50%, 61.8%, and 100%) on a chart, traders can gain insights into where the price might reverse. For instance, if Bitcoin retraces to the 61.8% level and shows signs of buying interest, traders may view this as a strong support level.
Pivot points offer a systematic approach to determining support and resistance levels. Calculated using the previous day's high, low, and close prices, pivot points provide key price levels to watch. These points can help traders identify potential entry and exit points, making them invaluable for short-term trading strategies. By understanding how to calculate and use pivot points, traders can enhance their decision-making process in the volatile Bitcoin market.
1. What is the difference between support and resistance?
Support is a price level where buying interest overcomes selling pressure, preventing the price from falling further. Resistance, on the other hand, is where selling interest overcomes buying pressure, causing the price to stop rising.
2. How can I identify support and resistance levels?
You can identify support and resistance levels by analyzing historical price movements, observing chart patterns, drawing trendlines, and using technical indicators like moving averages and Fibonacci retracement.
3. Why is volume important in confirming support and resistance?
Volume indicates the strength of a price movement. High volume at a support level suggests strong buying interest, while low volume at a resistance level may indicate weak selling pressure, potentially leading to a breakout.

Understanding Support and Resistance
Support and resistance are two of the most critical concepts in technical analysis, especially in the volatile world of Bitcoin trading. But what exactly do these terms mean? In simple terms, support refers to a price level where a downward trend can be expected to pause due to a concentration of demand. Think of it as a safety net for prices; when they start to fall, buyers step in, creating a floor. On the other hand, resistance is the opposite—a price point where an upward trend can be expected to stall due to a concentration of selling interest. Picture it like a ceiling; prices hit this level and sellers come in to push it back down.
Understanding these levels is crucial for traders because they help in making informed decisions. When you identify a support level, you might consider it a good point to buy, anticipating that the price will rebound. Conversely, recognizing a resistance level might signal a good opportunity to sell or short, as prices are likely to reverse direction. This understanding can be the difference between a profitable trade and a costly mistake.
To put it into perspective, imagine you're at a concert. The crowd (representing market participants) pushes forward, but when they hit the barrier (resistance), they can’t go any further. Similarly, if the crowd starts to retreat (downward movement), they might stop at a certain point where there’s enough space (support) to gather again. This dynamic creates a rhythm in price movements that traders can exploit for profit.
Moreover, support and resistance levels are not just static points; they can evolve over time. As more traders enter the market and react to price movements, these levels can shift, creating new opportunities and challenges. Therefore, it’s essential to keep an eye on these levels and adjust your trading strategy accordingly.
In Bitcoin trading, the significance of support and resistance is amplified due to its highly speculative nature. Prices can swing wildly, making these levels even more critical for risk management. By understanding where these levels lie, traders can better navigate the turbulent waters of Bitcoin's price action.
In summary, grasping the concepts of support and resistance is fundamental for anyone looking to trade Bitcoin effectively. These levels serve as indicators for potential price reversals and can guide traders in making strategic decisions. So, the next time you analyze a Bitcoin chart, remember to look for these crucial levels—they might just be the key to your trading success!

Historical Price Levels
When it comes to trading Bitcoin, understanding can be a game changer. These levels act like a treasure map, guiding traders through the often tumultuous waters of the cryptocurrency market. But what exactly are historical price levels? Simply put, they are the price points where Bitcoin has previously experienced significant buying or selling activity. These levels are crucial because they can indicate where the price might bounce back up (support) or where it might face resistance (resistance).
Analyzing past price movements allows traders to spot these potential support and resistance zones. For instance, if Bitcoin has repeatedly bounced off a certain price level, it suggests that many traders believe that price is a good entry point. Conversely, if Bitcoin struggles to break through a price ceiling, that level becomes a key resistance point. By identifying these zones, traders can make more informed decisions about when to buy or sell.
To illustrate this concept, let’s take a look at a hypothetical price chart:
| Price Level | Action | Significance |
|---|---|---|
| $30,000 | Support | Price has bounced off this level multiple times. |
| $35,000 | Resistance | Price has struggled to break above this level. |
| $25,000 | Support | Major buying activity observed in previous downturns. |
As you can see, these price levels are not just random numbers; they represent the collective sentiment of traders in the market. Understanding these levels can significantly enhance your trading strategy. It's like having a cheat sheet that highlights where others have made their moves before you. But remember, while historical price levels are important, they should not be the only factor in your trading decisions. Always consider other indicators and market conditions to get a complete picture.
In conclusion, by keeping an eye on historical price levels, you can better anticipate where Bitcoin might head next. It’s all about reading the signs and understanding the crowd's behavior. The more you practice this skill, the more intuitive it will become, allowing you to navigate the Bitcoin market with greater confidence and precision.
- What is the difference between support and resistance? Support refers to price levels where buying interest is strong enough to overcome selling pressure, while resistance is where selling interest is strong enough to overcome buying pressure.
- How can I find historical price levels? You can find historical price levels by analyzing past price charts and looking for areas with significant price action.
- Are historical price levels always reliable? While they can provide valuable insights, historical price levels are not foolproof and should be used in conjunction with other analysis techniques.

Chart Patterns
When it comes to trading Bitcoin, understanding is like having a treasure map. These patterns are visual representations of price movements that can help traders predict future price action. Just like a detective uses clues to solve a mystery, traders analyze these patterns to make informed decisions. Among the most common chart patterns are double tops, double bottoms, head and shoulders, and flags. Each of these patterns has its own significance and can indicate potential support and resistance levels.
For instance, a double top pattern typically appears after an upward trend and signals a potential reversal. It consists of two peaks at roughly the same price level, indicating that buyers are losing strength. On the other hand, a double bottom pattern suggests a potential bullish reversal after a downtrend, characterized by two troughs at similar price levels. Recognizing these patterns can give traders a significant edge, allowing them to anticipate market movements.
Another pattern worth noting is the head and shoulders. This pattern can be a powerful indicator of a trend reversal. It consists of three peaks: a higher peak (the head) between two lower peaks (the shoulders). If you spot this pattern, it might be time to reconsider your position. Conversely, the inverse head and shoulders pattern suggests a bullish reversal and is formed in a similar manner but inverted.
Flags and pennants are also critical patterns that indicate a continuation of the current trend. Flags are rectangular-shaped and slope against the prevailing trend, while pennants are small symmetrical triangles that form after a strong price movement. Both patterns suggest a brief consolidation before the price continues in the direction of the original trend. Understanding these patterns can help traders set their stop-loss orders and take profit levels more effectively.
To summarize, recognizing chart patterns is essential for any Bitcoin trader looking to enhance their technical analysis skills. By understanding the implications of these patterns, traders can identify potential support and resistance levels, ultimately leading to more informed trading decisions. So, the next time you analyze a Bitcoin chart, keep an eye out for these patterns—they could be the key to unlocking your trading success!
- What are chart patterns? Chart patterns are formations created by the price movements of an asset on a chart, which can indicate potential future price movements.
- How can I identify a double top pattern? A double top pattern can be identified by two peaks at approximately the same price level, followed by a decline in price.
- What does a head and shoulders pattern indicate? A head and shoulders pattern typically indicates a reversal of the current trend, suggesting that the price may start to decline after the pattern completes.
- Are flags and pennants reliable indicators? Yes, flags and pennants are considered reliable continuation patterns that suggest the price will continue in the direction of the prevailing trend after a brief consolidation.

Trendlines
When it comes to identifying support and resistance levels in Bitcoin trading, are your best friends. Think of them as the roadmaps that guide you through the volatile landscape of cryptocurrency. By drawing trendlines, you can visualize the direction of price movements and pinpoint potential reversal points. But how do you draw these lines effectively? It’s simpler than you might think!
To start, you’ll want to connect at least two significant price points on a chart. For an upward trendline, draw a line connecting the lows of the price movements. Conversely, for a downward trendline, connect the highs. The more points you connect, the stronger the trendline becomes. This is crucial because a strong trendline indicates a reliable support or resistance level. Just like a sturdy bridge can support heavy traffic, a strong trendline can withstand the fluctuations of Bitcoin's price.
One of the most exciting aspects of trendlines is their ability to provide dynamic support and resistance. Unlike static levels, which remain fixed, trendlines can change as the price moves. For instance, if Bitcoin is in an uptrend, the trendline acts as a support level; prices may bounce off it, giving traders a signal to buy. On the flip side, in a downtrend, the trendline serves as a resistance level, where price may struggle to break through, signaling a potential sell opportunity.
Now, let’s talk about how to spot trendline breaks. A break occurs when the price moves significantly above or below the trendline. This is often a sign that the current trend may be losing momentum, and a reversal could be on the horizon. Imagine a rubber band stretched to its limit; once it snaps, it can go in an entirely different direction. Therefore, recognizing these breaks can be pivotal in making informed trading decisions.
To sum it up, here are some key points to remember about trendlines:
- Connect at least two significant price points to draw a trendline.
- Use upward trendlines to identify support and downward trendlines for resistance.
- Watch for trendline breaks as indicators of potential reversals.
Incorporating trendlines into your Bitcoin trading strategy can enhance your ability to identify critical support and resistance levels. So grab your charting tool, start drawing those lines, and let the market reveal its secrets to you!
Moving Averages
Moving averages are an essential tool in the arsenal of any Bitcoin trader, acting as dynamic support and resistance levels. They are like the compass guiding you through the often turbulent waters of cryptocurrency trading. By smoothing out price data over a specified period, moving averages help traders identify trends and potential reversal points. Imagine you're on a roller coaster; moving averages are the safety bar that keeps you secure as you navigate the ups and downs of the market.
There are several types of moving averages, each with its unique characteristics and applications:
- Simple Moving Average (SMA): This is the most basic form of moving average, calculated by taking the average price of Bitcoin over a specific number of periods. For instance, a 50-day SMA provides insights into the average price over the last 50 days, helping traders understand the general trend.
- Exponential Moving Average (EMA): Unlike the SMA, the EMA gives more weight to recent prices, making it more responsive to new information. This can be particularly useful in the fast-paced world of Bitcoin trading, where conditions can change in the blink of an eye.
- Weighted Moving Average (WMA): Similar to the EMA, the WMA assigns different weights to prices, but it does so in a linear manner. This means that the most recent prices have a greater impact on the average, helping traders react more quickly to market movements.
To effectively use moving averages in your trading strategy, it's crucial to understand how they interact with price movements. For example, when the price of Bitcoin is above the moving average, it often indicates a bullish trend, suggesting that traders might consider buying. Conversely, if the price dips below the moving average, it can signal a bearish trend, prompting traders to think about selling or shorting their positions.
Moreover, moving averages can also be used in conjunction with other technical indicators to confirm trading signals. For instance, when a shorter-term moving average crosses above a longer-term moving average, it creates what is known as a "golden cross," which can be a strong buy signal. On the flip side, a "death cross," where a shorter-term moving average crosses below a longer-term one, can indicate a sell signal.
It's important to remember that while moving averages can provide valuable insights, they are not foolproof. They are lagging indicators, meaning they react to price movements rather than predict them. Therefore, it's wise to use them as part of a broader trading strategy that includes other forms of analysis, such as volume and chart patterns.
In summary, moving averages are a powerful tool for identifying potential support and resistance levels in Bitcoin trading. By understanding their types and applications, traders can make more informed decisions and navigate the volatile crypto market with greater confidence.
1. What is the best moving average to use for Bitcoin trading?
There isn't a one-size-fits-all answer, as different traders may prefer different moving averages based on their strategies. However, many traders commonly use the 50-day and 200-day moving averages for long-term trends.
2. How do I calculate a moving average?
To calculate a simple moving average, add up the closing prices of Bitcoin for a specific number of periods and then divide by that number. For example, for a 10-day SMA, sum the closing prices for the last 10 days and divide by 10.
3. Can moving averages be used for day trading?
Absolutely! Many day traders use shorter moving averages, such as the 5-minute or 15-minute EMA, to make quick trading decisions based on short-term price movements.
4. What should I do if the price is fluctuating around the moving average?
When the price hovers around the moving average, it can indicate indecision in the market. In such cases, it may be wise to wait for a clearer trend to emerge before making any trading decisions.

Volume Analysis
When it comes to trading Bitcoin, is like having a secret decoder ring. It helps you understand the strength behind price movements and can significantly improve your trading decisions. So, what exactly is volume? In simple terms, volume refers to the number of coins traded during a specific period. High volume often indicates strong interest in a price move, while low volume may suggest a lack of conviction among traders.
Imagine you're at a concert. If the crowd is roaring and singing along, you know the band is doing something right. Similarly, in the world of Bitcoin, a surge in volume can signal that a price breakout is genuine and might continue. On the flip side, if the volume is low while prices are rising, it could mean that the rally is weak and may not last long. This is why understanding volume is crucial.
To effectively analyze volume, traders often look for the following key aspects:
- Volume Spikes: Sudden increases in volume can indicate a potential reversal or continuation of a trend. For instance, if Bitcoin has been in a downtrend and suddenly experiences a spike in volume, it might suggest that buyers are stepping in, possibly leading to a price recovery.
- Volume Patterns: Consistent volume patterns can help traders identify trends. For example, if Bitcoin's price is moving upwards while volume increases, it reinforces the strength of the upward move.
- Volume Divergence: This occurs when the price is moving in one direction while the volume is moving in the opposite direction. This can be a warning sign that the current trend may be losing momentum.
To illustrate how volume analysis works, let’s take a look at a hypothetical scenario:
| Date | Price ($) | Volume (BTC) |
|---|---|---|
| 01/01/2023 | 30,000 | 500 |
| 01/02/2023 | 32,000 | 800 |
| 01/03/2023 | 31,000 | 300 |
| 01/04/2023 | 33,500 | 1,200 |
In this table, we can see that on January 4th, the price of Bitcoin increased significantly to $33,500, accompanied by a volume spike of 1,200 BTC. This suggests that the price increase was backed by strong trading activity, indicating a potential continuation of the upward trend.
In conclusion, volume analysis is an essential tool for any Bitcoin trader. By keeping an eye on trading volume, you can gain insights into market sentiment and make more informed trading decisions. Just remember, in the world of Bitcoin, where volatility is the name of the game, understanding the volume can be your best friend!
Q1: Why is volume important in Bitcoin trading?
Volume is important because it helps traders gauge the strength of price movements. High volume often indicates strong interest and can signal potential trend continuations or reversals.
Q2: How can I track Bitcoin trading volume?
You can track Bitcoin trading volume through various cryptocurrency exchanges and financial platforms that provide real-time data and charts.
Q3: What should I do if I see a volume spike?
If you see a volume spike, it’s essential to analyze the context. Consider other indicators, such as price action and market news, to determine whether the spike suggests a genuine trend change or a false signal.

Indicators and Tools
When it comes to trading Bitcoin, having the right at your disposal can make a world of difference. These resources not only help you identify potential support and resistance levels but also enhance your overall trading strategy. Think of them as your trusty compass in the unpredictable sea of cryptocurrency trading. In this section, we’ll explore some of the most popular indicators and tools that can assist you in your Bitcoin analysis.
One of the most widely used tools in technical analysis is the Relative Strength Index (RSI). This momentum oscillator measures the speed and change of price movements, helping traders identify overbought or oversold conditions in the market. An RSI reading above 70 typically indicates that Bitcoin may be overbought, while a reading below 30 suggests it could be oversold. By keeping an eye on these levels, you can better anticipate potential reversals or corrections in the price.
Another essential indicator is the Moving Average Convergence Divergence (MACD). This tool helps traders spot changes in momentum by comparing two different moving averages. The MACD line crossing above the signal line can indicate a bullish trend, whereas crossing below can signal a bearish trend. By using the MACD in conjunction with support and resistance levels, you can gain deeper insights into potential price movements.
Now, let’s not forget about the Bollinger Bands. These bands are a volatility indicator that consists of a middle band (a simple moving average) and two outer bands that represent standard deviations from the average. When the price approaches the upper band, it may indicate overbought conditions, while approaching the lower band may suggest oversold conditions. This can be particularly useful when combined with support and resistance levels, as it helps traders gauge whether a price is likely to bounce back or break through a level.
Additionally, volume indicators play a critical role in confirming support and resistance levels. High trading volume often indicates strong interest in a particular price level, making it more likely to act as a support or resistance point. By analyzing volume alongside price movements, traders can enhance their decision-making process. For instance, if Bitcoin approaches a resistance level with increasing volume, it may suggest a stronger likelihood of a breakout.
To summarize, here are some key indicators and tools that can aid in identifying support and resistance levels in Bitcoin:
- Relative Strength Index (RSI): Measures overbought and oversold conditions.
- Moving Average Convergence Divergence (MACD): Identifies changes in momentum.
- Bollinger Bands: Assesses volatility and potential price reversals.
- Volume Indicators: Confirms the strength of support and resistance levels.
By incorporating these indicators and tools into your trading strategy, you can make more informed decisions and navigate the Bitcoin market with greater confidence. Remember, though, that no indicator is foolproof. It’s always wise to combine different tools and analyses to paint a clearer picture of market trends.
Q1: How do I choose the right indicators for Bitcoin trading?
A1: The right indicators depend on your trading style and strategy. A combination of momentum, trend, and volume indicators often provides a well-rounded approach.
Q2: Can I rely solely on indicators for trading decisions?
A2: While indicators are useful, they should not be your only source of information. Always consider market news, sentiment, and other factors.
Q3: How often should I check my indicators?
A3: It's best to monitor your indicators regularly, especially during significant price movements or market news events.

Fibonacci Retracement
The tool is a favorite among traders for identifying potential support and resistance levels in the volatile world of Bitcoin trading. This technique is based on the Fibonacci sequence, a mathematical series where each number is the sum of the two preceding ones. When applied to trading, specific ratios derived from this sequence—namely 23.6%, 38.2%, 50%, 61.8%, and 100%—are used to predict where the price may retrace before continuing its trend. But how do you use these levels effectively?
First, it's essential to identify a significant price movement, either upward or downward. Once you've pinpointed this movement, you can apply the Fibonacci retracement tool by selecting the high and low points of the trend. The tool will then automatically plot horizontal lines at the Fibonacci levels, which serve as potential reversal points. For example, if Bitcoin has surged from $30,000 to $40,000, you would draw the retracement from the low of $30,000 to the high of $40,000. This would create levels at which traders might anticipate price corrections.
Now, you might wonder, why do these specific Fibonacci levels work? The answer lies in the psychology of traders. Many market participants watch these levels closely, leading to increased buying or selling activity when the price approaches them. This collective behavior can create a self-fulfilling prophecy, where the price reacts to these levels simply because many traders expect it to. Thus, understanding Fibonacci retracement can give you an edge in predicting market movements.
To illustrate the effectiveness of Fibonacci retracement, consider the following table, which shows hypothetical Bitcoin price movements and corresponding Fibonacci levels:
| Price Movement | Fibonacci Level | Potential Action |
|---|---|---|
| $30,000 to $40,000 | 23.6% - $38,236 | Watch for potential resistance |
| $30,000 to $40,000 | 38.2% - $37,382 | Potential buying opportunity |
| $30,000 to $40,000 | 50% - $35,000 | Strong support level |
| $30,000 to $40,000 | 61.8% - $32,618 | Critical support area |
In conclusion, incorporating Fibonacci retracement levels into your Bitcoin trading strategy can provide valuable insights into potential price movements. However, it's crucial to use them in conjunction with other technical analysis tools and indicators to enhance your trading decisions further. Remember, no single tool is foolproof, so always be prepared for unexpected market fluctuations!
- What is Fibonacci retracement? - It's a tool used to identify potential support and resistance levels based on the Fibonacci sequence.
- How do I apply Fibonacci retracement in Bitcoin trading? - Identify a significant price movement, select the high and low points, and apply the Fibonacci tool to visualize potential reversal levels.
- Are Fibonacci levels always accurate? - While they can be effective, they are not guaranteed. It's best to use them alongside other indicators.
- Can Fibonacci retracement be used for other cryptocurrencies? - Absolutely! The Fibonacci retracement tool can be applied to any financial asset, including other cryptocurrencies.

Pivot Points
Pivot points are a popular technical analysis tool used by traders to determine potential support and resistance levels in the market. They act as a compass, guiding traders through the often turbulent waters of Bitcoin trading by providing key price levels that can indicate market sentiment. But how exactly do they work? Let's break it down.
At their core, pivot points are calculated based on the previous period's high, low, and closing prices. The main pivot point (PP) is the average of these three values, and from this central point, additional support and resistance levels are derived. The formula for calculating the main pivot point is:
PP (High + Low + Close) / 3
Once you have the main pivot point, you can calculate the support and resistance levels as follows:
- First Resistance (R1): R1 (2 x PP) - Low
- First Support (S1): S1 (2 x PP) - High
- Second Resistance (R2): R2 PP + (High - Low)
- Second Support (S2): S2 PP - (High - Low)
Using these calculated levels, traders can make informed decisions about entering or exiting trades. For instance, if the price nears a resistance level and shows signs of reversal, it may be a good opportunity to sell or short. Conversely, if the price approaches a support level and starts to bounce back, it could indicate a buying opportunity.
One of the key advantages of using pivot points is their ability to adapt to different time frames. Whether you're day trading or looking at longer-term positions, pivot points can be calculated for any period—be it daily, weekly, or monthly. This flexibility allows traders to maintain a clear perspective on market dynamics, regardless of their trading style.
Moreover, pivot points can be a wonderful complement to other technical analysis tools. For example, if you notice that the price is approaching a pivot point coinciding with a trendline or a moving average, it can reinforce the likelihood of that level holding as support or resistance. This synergy can enhance your trading strategy, making it more robust and reliable.
In conclusion, pivot points are a straightforward yet powerful tool for identifying key price levels in Bitcoin trading. By understanding how to calculate and interpret these points, traders can gain valuable insights into market behavior, helping them navigate their trading journey with greater confidence.
- What are pivot points? Pivot points are calculated price levels used to identify potential support and resistance in the market.
- How do I calculate pivot points? You can calculate pivot points using the previous period's high, low, and close prices with specific formulas.
- Can pivot points be used for different time frames? Yes, pivot points can be calculated for daily, weekly, or monthly periods, making them versatile for various trading styles.
- How do I use pivot points in trading? Traders use pivot points to identify potential reversal points, entry and exit strategies based on price action around these levels.
Frequently Asked Questions
- What are support and resistance levels in Bitcoin trading?
Support and resistance levels are crucial concepts in technical analysis. Support refers to a price level where a downtrend can be expected to pause due to a concentration of demand. Conversely, resistance is a price level where an uptrend can be expected to pause due to a concentration of selling. Identifying these levels can help traders make informed decisions about entry and exit points.
- How can historical price levels help in identifying support and resistance?
Analyzing historical price levels allows traders to spot potential support and resistance zones. Past price movements often create psychological barriers. For instance, if Bitcoin consistently bounces back from a certain price level, that level is likely to act as support in the future. Similarly, if Bitcoin struggles to break above a specific price point, that level may serve as resistance.
- What role do chart patterns play in identifying support and resistance?
Chart patterns, such as double tops and bottoms, are visual indicators of potential support and resistance levels. These patterns can signal that a price reversal is imminent. For example, a double top pattern suggests that Bitcoin has reached a peak and may soon decline, indicating a resistance level. Recognizing these patterns can provide traders with valuable insights into market behavior.
- How do trendlines help in identifying these levels?
Trendlines are essential tools for visualizing support and resistance. By connecting significant price points on a chart, traders can draw trendlines that indicate potential reversal points. An upward trendline suggests support, while a downward trendline indicates resistance. By using trendlines effectively, traders can enhance their understanding of market trends.
- What are moving averages and how do they relate to support and resistance?
Moving averages are used to smooth out price data and can act as dynamic support and resistance levels. Different types of moving averages, such as the simple moving average (SMA) and exponential moving average (EMA), can provide insights into market trends. When the price approaches a moving average, it may either bounce off it (acting as support) or struggle to break through it (acting as resistance).
- How does volume analysis enhance the identification of support and resistance?
Volume analysis is critical in confirming support and resistance levels. A high trading volume at a specific price level suggests strong interest, making it more likely that this level will hold as support or resistance. Conversely, low volume may indicate a lack of conviction, leading to potential breakouts or breakdowns. Monitoring volume helps traders validate their analysis.
- What are Fibonacci retracement levels and how are they used?
Fibonacci retracement levels are popular tools for identifying potential support and resistance levels based on the Fibonacci sequence. Traders use these levels to predict price corrections after a significant price movement. By applying Fibonacci retracement, traders can identify areas where Bitcoin might reverse or consolidate, helping them make informed trading decisions.
- How do pivot points assist in determining support and resistance?
Pivot points provide a systematic approach to identifying support and resistance levels. By calculating the average of the high, low, and closing prices from the previous trading period, traders can establish key pivot levels for the current period. These levels can serve as potential entry or exit points, helping traders navigate the market more effectively.


