
Evaluating Different Trading Strategies
In the dynamic world of trading, understanding the various strategies available is essential for anyone looking to maximize their potential for profit while minimizing risks. With countless methods at their disposal, traders often find themselves asking: "Which strategy suits my goals and risk tolerance?" This article delves into the nuances of different trading strategies, shedding light on their effectiveness and helping traders make informed decisions. By evaluating each strategy's potential benefits and drawbacks, we aim to equip you with the knowledge necessary to navigate the complex financial markets.
Trading strategies serve as the backbone of any successful trading endeavor. They are not just random choices made in the heat of the moment; rather, they are well-thought-out plans that guide traders in making informed decisions. Each strategy is designed to align with the trader's objectives, whether they are seeking short-term gains or long-term investments. By understanding the significance of these strategies, traders can better position themselves to react to market fluctuations and harness opportunities as they arise.
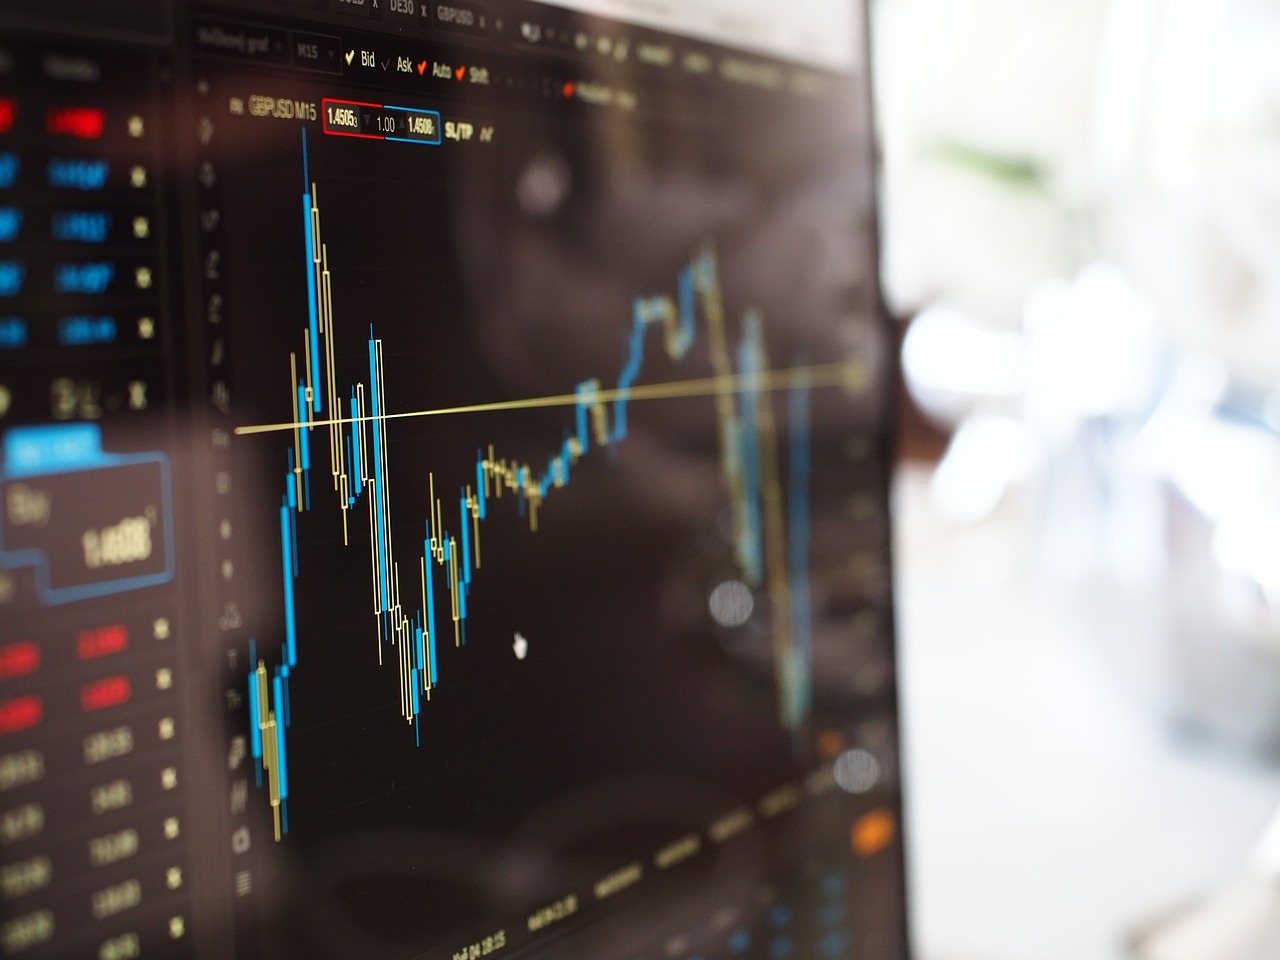
One of the most popular approaches to trading is technical analysis. This method relies on historical price data to forecast future market movements. Traders utilize various tools, including chart patterns and indicators, to identify trends and potential entry and exit points. By analyzing past market behavior, traders can make educated guesses about where prices are headed next. So, let's dive deeper into the world of technical analysis and explore some of its core components.
Chart patterns are visual representations of market behavior that can provide valuable insights into future price movements. Recognizing these patterns is crucial for traders looking to capitalize on market trends. Some of the most popular chart patterns include:
- Head and Shoulders: This pattern often signals a reversal in trend, indicating that a bullish trend may be coming to an end.
- Double Tops: A double top pattern suggests that prices may be about to decline after reaching a peak twice.
- Triangles: These patterns indicate potential continuation or reversal of trends, depending on the breakout direction.
Understanding these patterns and their implications can significantly influence trading decisions, allowing traders to enter or exit positions with greater confidence.
Reversal patterns are critical for traders aiming to identify potential market trend changes. By recognizing these patterns, traders can pinpoint optimal entry and exit points. For instance, a Head and Shoulders pattern signals that a bullish trend may be reversing, providing traders with an opportunity to sell before prices decline.
On the other hand, continuation patterns suggest that existing trends are likely to persist. Patterns such as flags and pennants often indicate that after a brief consolidation phase, the market will continue in its current direction. Recognizing these patterns can help traders maintain their positions and ride the trend for maximum profit.
Indicators and oscillators are essential tools in technical analysis, allowing traders to gauge market momentum and identify overbought or oversold conditions. For example, the Relative Strength Index (RSI) can help traders determine whether an asset is overbought or oversold, prompting them to make informed decisions about entering or exiting trades.
While technical analysis focuses on historical price data, fundamental analysis takes a broader approach by evaluating economic indicators, company performance, and overall market conditions. This method is particularly important for long-term trading strategies and investment decisions. By understanding the underlying factors that drive market movements, traders can make more informed choices.
Economic indicators provide vital insights into market health. Key indicators such as GDP growth rates and unemployment statistics can significantly impact trading strategies. For instance, a rising GDP may indicate a strengthening economy, prompting traders to consider bullish positions.
For stock traders, analyzing a company's financial statements is crucial. Metrics like earnings per share (EPS) and revenue growth can influence trading decisions. A company showing consistent revenue growth may attract traders looking for long-term investments, while declining financials may prompt caution.
Effective risk management is the cornerstone of successful trading. Without it, even the most promising strategies can lead to significant losses. Traders can employ various techniques to minimize risks and protect their capital while pursuing profits.
Position sizing is about determining how much capital to allocate to each trade. By calculating position sizes based on risk tolerance and account size, traders can ensure they don’t overexpose themselves to any single trade, which is crucial for long-term success.
Stop-loss orders are essential tools for protecting investments. By setting effective stop-loss levels, traders can limit potential losses in volatile markets. This strategy allows for a disciplined approach to trading, ensuring that emotions don’t dictate decisions.
Backtesting is a powerful method that allows traders to assess the viability of their strategies using historical data. By simulating trades based on past market conditions, traders can refine their approaches and improve performance.
Selecting appropriate historical data is crucial for accurate backtesting. Traders should consider factors such as time frames and market conditions when sourcing data to ensure their backtests reflect realistic scenarios.
Understanding backtest results is key to evaluating trading strategies. Metrics such as win rate and drawdown provide valuable insights into a strategy's performance, helping traders make informed decisions about their trading approaches.
The psychology of trading plays a significant role in performance. Emotions can cloud judgment and lead to impulsive decisions, which is why maintaining mental discipline is crucial for traders. Developing a solid trading plan that incorporates strategies, risk management, and psychological considerations can greatly enhance trading success.
Maintaining emotional discipline is vital for traders. Strategies to manage emotions and avoid impulsive decisions during trading can include setting clear rules, taking breaks, and practicing mindfulness. This discipline can be the difference between a successful trader and one who succumbs to the emotional rollercoaster of the markets.
A solid trading plan is essential for success. Traders should outline their strategies, risk management techniques, and psychological considerations in a comprehensive plan. This roadmap can help traders stay focused and disciplined, even in the most turbulent market conditions.
Q: What is the best trading strategy for beginners?
A: Beginners often benefit from simpler strategies, such as trend following or using basic technical indicators to guide their trades.
Q: How important is risk management?
A: Risk management is crucial for long-term trading success. It helps protect your capital and minimizes potential losses.
Q: Can I rely solely on technical analysis?
A: While technical analysis is valuable, combining it with fundamental analysis can provide a more comprehensive view of market conditions.
Q: What role does psychology play in trading?
A: Psychology significantly impacts trading performance. Managing emotions and maintaining discipline are key factors in successful trading.

Understanding Trading Strategies
When it comes to trading in financial markets, having a solid understanding of trading strategies is crucial. These strategies serve as the backbone for traders, guiding them through the often turbulent waters of market fluctuations. Just like a sailor needs a map to navigate the seas, traders rely on these strategies to make informed decisions based on both market analysis and their individual objectives. The significance of trading strategies cannot be overstated; they help traders determine when to enter or exit a position, how much capital to invest, and what risks they are willing to take.
At its core, a trading strategy is a well-defined plan that outlines how a trader intends to achieve their financial goals. This plan can be based on various factors, including technical analysis, fundamental analysis, or a combination of both. Each strategy comes with its own set of rules and guidelines that dictate how trades should be executed. In essence, the effectiveness of a trading strategy is often measured by its ability to generate consistent profits while managing risk effectively.
There are several types of trading strategies, each catering to different trading styles and market conditions. For instance, some traders may prefer day trading, where positions are opened and closed within a single trading day, while others might opt for swing trading, which involves holding positions for several days or weeks. Additionally, long-term investors might focus on buy-and-hold strategies, where they purchase stocks and hold them for extended periods, betting on the company's growth over time.
Understanding your own risk tolerance is also a critical component when evaluating trading strategies. Some traders thrive on taking high risks for potentially high rewards, while others prefer a more conservative approach. This self-awareness allows traders to select strategies that align with their financial goals and psychological comfort levels. For example, a trader who is risk-averse might lean towards fundamental analysis strategies, focusing on the long-term stability of a company, while a more aggressive trader might favor technical analysis, looking for quick gains based on short-term market movements.
Ultimately, the journey of understanding trading strategies is an ongoing process. It requires continuous learning, adaptation, and a willingness to embrace new information and techniques. As markets evolve, so too should the strategies employed by traders. By staying informed and flexible, traders can better position themselves to seize opportunities and navigate challenges, ensuring they remain competitive in an ever-changing financial landscape.
- What is a trading strategy? A trading strategy is a systematic plan that outlines how a trader will enter and exit trades based on specific criteria.
- Why are trading strategies important? They help traders make informed decisions, manage risk, and achieve their financial goals.
- How do I choose the right trading strategy? Consider your financial objectives, risk tolerance, and the amount of time you can dedicate to trading.
- Can I use multiple trading strategies? Yes, many traders use a combination of strategies to adapt to different market conditions.
Technical Analysis
Technical analysis is a method used by traders to evaluate and predict future price movements based on historical price data. By examining chart patterns, indicators, and trends, traders can make informed decisions that align with their trading strategies. The beauty of technical analysis lies in its ability to simplify complex market behaviors into visual representations. Imagine trying to read a book with no chapters or paragraphs; it would be a daunting task. Similarly, technical analysis breaks down market data into digestible pieces, allowing traders to focus on key signals that can guide their trades.
At its core, technical analysis is built on the premise that all relevant information is already reflected in the price of a security. This means that rather than spending time analyzing news articles or economic reports, traders can rely on charts and indicators to assess market sentiment and potential future movements. It's like trying to find your way through a maze; instead of wandering aimlessly, you can use a map (the chart) that shows you the paths that have been taken before.
One of the most powerful aspects of technical analysis is the use of chart patterns. These patterns are visual formations created by the price movements of a security over time. Traders look for specific patterns that have historically indicated potential price reversals or continuations. Some popular chart patterns include:
- Head and Shoulders: This pattern typically signals a reversal in trend.
- Double Tops and Bottoms: These are indicative of potential market reversals.
- Triangles: These patterns can suggest continuation or reversal, depending on their formation.
Within these chart patterns, there are two main categories: reversal patterns and continuation patterns. Reversal patterns, such as the head and shoulders, indicate that a trend is about to change direction. Understanding these can help traders identify optimal entry and exit points. On the other hand, continuation patterns suggest that a current trend is likely to persist. Recognizing these patterns allows traders to align their strategies with the prevailing market momentum.
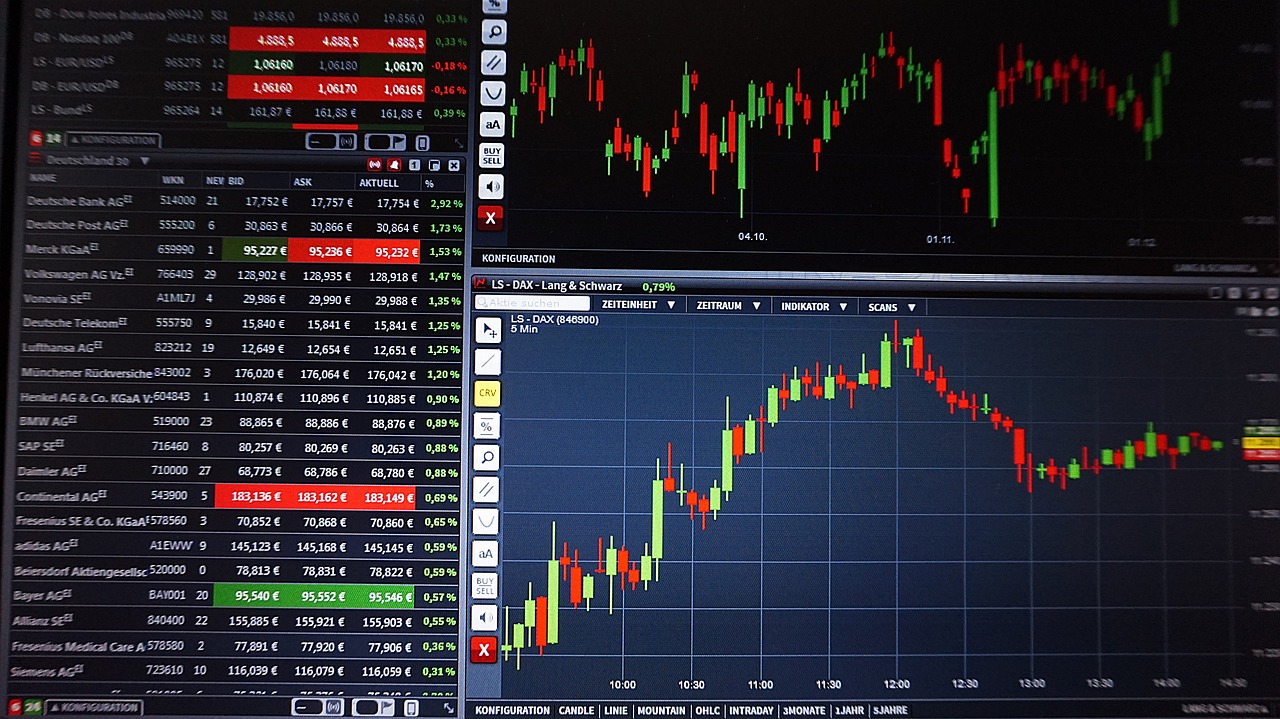
In addition to chart patterns, traders also utilize various indicators and oscillators as part of their technical analysis toolkit. These tools help gauge market momentum and identify overbought or oversold conditions. For instance, the Relative Strength Index (RSI) is a popular oscillator that measures the speed and change of price movements on a scale of 0 to 100. A reading above 70 typically indicates an overbought condition, while a reading below 30 suggests that a security may be oversold. It's akin to checking the temperature before going outside; it helps you determine whether it's a good time to enter the market or wait for a better opportunity.
Ultimately, the effectiveness of technical analysis relies on the trader's ability to interpret these patterns and indicators correctly. While historical data can provide insights into potential future movements, it's important to remember that no strategy is foolproof. Market conditions can change rapidly, influenced by a myriad of factors, including economic news and geopolitical events. Therefore, combining technical analysis with sound risk management practices is essential for navigating the unpredictable waters of trading.

Chart Patterns
Chart patterns are like the fingerprints of the market, each telling a unique story about the price action of an asset. They provide visual representations of market behavior, allowing traders to identify potential trading opportunities based on historical trends. By recognizing these patterns, traders can make informed decisions about when to enter or exit a trade. Essentially, chart patterns serve as a roadmap, guiding traders through the often tumultuous landscape of financial markets.
Among the most popular chart patterns are the head and shoulders and double tops. Each pattern has its own implications and can signal different market movements. For example, the head and shoulders pattern often indicates a reversal in trend, suggesting that the price may soon decline after an upward movement. Conversely, the double top pattern also signals a potential reversal, indicating that the price has peaked and may start to fall.
It's important to note that not all patterns guarantee success; they are merely tools that can assist traders in making educated guesses about market direction. Traders often combine these patterns with other forms of analysis, such as indicators and oscillators, to enhance their decision-making process. However, understanding the nuances of each pattern can provide a significant edge in trading.
Reversal patterns are crucial for traders looking to identify potential changes in market direction. These patterns, such as the head and shoulders and inverse head and shoulders, signal that a prevailing trend may be coming to an end. Recognizing these patterns can help traders pinpoint optimal entry and exit points. For instance, if a trader spots a head and shoulders pattern forming after a bullish trend, it may be a sign to consider selling before the price starts to decline.
On the flip side, continuation patterns indicate that a trend is likely to persist. Patterns like flags and pennants suggest that, after a brief consolidation phase, the price will continue in the same direction. For traders, these patterns can be golden opportunities to ride the momentum of the existing trend. By identifying a continuation pattern, traders can position themselves to maximize profits as the trend resumes.
To summarize, chart patterns are invaluable tools in a trader's arsenal. They offer insights into potential market movements and can significantly influence trading decisions. However, like any tool, their effectiveness is enhanced when used in conjunction with other analysis techniques. As you delve deeper into the world of trading, mastering chart patterns will undoubtedly enrich your trading strategy and improve your chances of success.
- What are chart patterns? Chart patterns are formations created by the price movements of an asset on a chart, helping traders predict future price movements.
- How can I identify reversal patterns? Look for specific formations, such as head and shoulders or double tops, that indicate a shift in market direction.
- Are continuation patterns reliable? While no pattern guarantees success, continuation patterns can provide strong indications that a trend will persist.
- Should I use chart patterns alone? It's best to combine chart patterns with other analysis methods, such as technical indicators, to enhance your trading decisions.

Reversal Patterns
Reversal patterns are critical indicators in the world of trading, acting as signposts that signal potential changes in market trends. Understanding these patterns can empower traders to identify optimal entry and exit points, ultimately enhancing their decision-making process. When a market is trending in one direction, a reversal pattern suggests that it may soon shift to move in the opposite direction. This is akin to watching a river flow; at times, the current may suddenly change course, and recognizing the signs of that shift can be the difference between a profitable trade and a missed opportunity.
Among the most recognized reversal patterns are the head and shoulders and the double top. The head and shoulders pattern typically appears at the top of an uptrend, indicating a potential bearish reversal. It consists of three peaks: a higher peak (the head) between two lower peaks (the shoulders). Conversely, the double top pattern also signals a bearish reversal, characterized by two peaks at roughly the same price level. These patterns are crucial for traders looking to capitalize on market shifts.
On the flip side, there are bullish reversal patterns like the inverse head and shoulders and the double bottom. The inverse head and shoulders pattern forms after a downtrend and consists of three troughs, with the middle trough being the deepest. This pattern suggests that a bullish reversal may be on the horizon. Similarly, the double bottom pattern appears at the end of a downtrend and is marked by two distinct troughs at about the same price level, indicating a potential upward reversal.
| Reversal Pattern | Description | Market Implication |
|---|---|---|
| Head and Shoulders | Three peaks: one higher (head) between two lower (shoulders) | Bearish reversal |
| Double Top | Two peaks at roughly the same price level | Bearish reversal |
| Inverse Head and Shoulders | Three troughs: one lower (head) between two higher (shoulders) | Bullish reversal |
| Double Bottom | Two troughs at roughly the same price level | Bullish reversal |
Recognizing these patterns can significantly enhance a trader's ability to make informed decisions. However, it is essential to combine pattern recognition with other forms of analysis, such as technical indicators and market sentiment. This multi-faceted approach is akin to piecing together a puzzle; each piece contributes to a clearer picture of market dynamics. Ultimately, successful traders continuously refine their understanding of reversal patterns and integrate them into their broader trading strategies.
As you delve deeper into the world of trading, remember that while reversal patterns provide valuable insights, they are not foolproof. Market conditions can change rapidly, and external factors can influence price movements. Therefore, maintaining a flexible mindset and being prepared for various outcomes is crucial. The more you practice identifying these patterns in real-time market scenarios, the more adept you'll become at leveraging them to your advantage.
- What is a reversal pattern? A reversal pattern indicates a potential change in market direction, signaling traders to adjust their strategies accordingly.
- How can I identify reversal patterns? Traders typically look for specific formations on price charts, such as head and shoulders or double tops/bottoms, to identify potential reversals.
- Are reversal patterns reliable? While reversal patterns can provide insights, they are not guaranteed indicators of future price movements. It's essential to use them in conjunction with other analysis methods.
- What should I do if I see a reversal pattern? If you identify a reversal pattern, consider your trading strategy and risk tolerance. It may be an opportunity to enter or exit a trade, but always confirm with additional analysis.

Continuation Patterns
When diving into the world of trading, understanding is like discovering a secret code that can unlock potential profit opportunities. These patterns signify that a prevailing trend—whether it’s upward or downward—is likely to persist, giving traders a chance to ride the wave rather than get caught in the undertow. Imagine you're surfing; you want to catch the right wave at the right time, and continuation patterns help you identify those perfect moments.
One of the most common types of continuation patterns is the flag. Flags are characterized by a sharp price movement followed by a consolidation phase that resembles a rectangle or parallelogram. Think of it like a flag flapping in the wind; after a strong rally, the price takes a breather before continuing its upward trajectory. Traders often look for a breakout from the flag pattern to confirm the continuation of the trend.
Another notable continuation pattern is the pennant. Similar to flags, pennants form after a significant price movement but are typically more symmetrical, resembling a small triangle. The price consolidates within this triangle before breaking out in the direction of the previous trend. It’s as if the market is gathering energy, preparing for another explosive move. Recognizing these patterns can be crucial for traders aiming to maximize their gains during strong trends.
To illustrate these concepts, let’s take a look at a simple table summarizing some key continuation patterns:
| Pattern | Description | Market Behavior |
|---|---|---|
| Flag | Consolidation after a sharp price movement | Indicates a continuation of the trend |
| Pennant | Symmetrical triangle formation after a price movement | Prepares for a breakout in the prevailing trend |
| Ascending Triangle | Flat upper trendline with rising lower trendline | Typically bullish; suggests a breakout upward |
| Descending Triangle | Flat lower trendline with declining upper trendline | Typically bearish; suggests a breakout downward |
Now, you may wonder, how can traders effectively utilize these patterns? The key is to look for confirmation signals. For instance, after identifying a flag pattern, traders often wait for a breakout above the flag’s upper boundary with increased volume. This is akin to waiting for the green light before proceeding through an intersection. Without that confirmation, the risk of false breakouts looms large.
Moreover, incorporating other technical indicators can enhance the reliability of these patterns. For example, using moving averages alongside continuation patterns can provide additional context. If a breakout occurs above a flag pattern while the price is above a moving average, it reinforces the bullish sentiment. It’s like having a trusted sidekick in your trading journey, helping you make more informed decisions.
In summary, mastering continuation patterns is essential for traders who wish to capitalize on ongoing trends. By recognizing these patterns and understanding their implications, traders can position themselves to enter trades at optimal times, maximizing their potential for profit while minimizing risks. Just remember, the market is full of surprises, and while continuation patterns can provide guidance, they are not foolproof. Always be prepared for the unexpected!
- What are continuation patterns? Continuation patterns are chart formations that suggest a prevailing trend is likely to continue after a brief consolidation period.
- How can I identify continuation patterns? Look for specific formations like flags, pennants, ascending triangles, and descending triangles on price charts.
- Are continuation patterns reliable? While they can be effective, it’s crucial to wait for confirmation signals and consider using additional technical indicators to enhance reliability.
- What should I do if a continuation pattern fails? Always have a risk management strategy in place, such as stop-loss orders, to protect your capital in case of unexpected market movements.

Indicators and Oscillators
When it comes to trading, indicators and oscillators are like the compass and map for a sailor navigating the vast ocean of financial markets. They provide traders with critical insights into market momentum, helping them make informed decisions based on real-time data. But what exactly are these tools, and how can they elevate your trading game?
Indicators are mathematical calculations based on historical price and volume data. They help traders identify trends, potential reversals, and market strength. Some of the most popular indicators include the Moving Average (MA), Relative Strength Index (RSI), and Moving Average Convergence Divergence (MACD). Each of these indicators serves a unique purpose:
- Moving Average (MA): This indicator smooths out price data to identify the direction of the trend over a specific period.
- Relative Strength Index (RSI): A momentum oscillator that measures the speed and change of price movements, helping traders identify overbought or oversold conditions.
- Moving Average Convergence Divergence (MACD): This indicator shows the relationship between two moving averages of a security’s price, which can signal potential buy or sell opportunities.
On the other hand, oscillators are a specific type of indicator that fluctuate between a predetermined range, often used to identify overbought or oversold conditions in the market. They are particularly effective in sideways or ranging markets where price movements lack clear direction. The most commonly used oscillators include the Stochastic Oscillator and the Commodity Channel Index (CCI).
Understanding how to interpret these indicators and oscillators can significantly enhance your trading strategy. For instance, if the RSI is above 70, it may indicate that an asset is overbought, suggesting a potential price correction. Conversely, if the RSI is below 30, it may signal that the asset is oversold, presenting a potential buying opportunity. However, relying solely on these tools without considering other factors—like market conditions and economic indicators—can lead to misguided decisions.
Moreover, combining different indicators can provide a more comprehensive view of market dynamics. For example, using the MACD in conjunction with the RSI can help confirm signals and reduce the likelihood of false positives. By analyzing the convergence and divergence of these indicators, traders can better anticipate market movements and make more strategic trades.
In conclusion, indicators and oscillators are invaluable tools in a trader's arsenal. They not only help in gauging market momentum but also aid in identifying entry and exit points. However, like any tool, they require skill and experience to wield effectively. As you delve deeper into the world of trading, remember that these indicators are most powerful when used in conjunction with a solid understanding of market fundamentals and risk management strategies.
- What are the most commonly used indicators in trading? The most commonly used indicators include Moving Averages, Relative Strength Index (RSI), and Moving Average Convergence Divergence (MACD).
- How do I know which indicator to use? The choice of indicator often depends on your trading style, objectives, and the market conditions. It's best to experiment with different ones to see what works for you.
- Can I rely solely on indicators for trading decisions? While indicators provide valuable insights, they should not be the only factor in your decision-making process. Always consider market fundamentals and other analyses.
Fundamental Analysis
When diving into the world of trading, is like having a treasure map. It guides traders through the complexities of the market by focusing on the underlying factors that influence asset prices. Unlike technical analysis, which looks at price movements and patterns, fundamental analysis digs deeper into the economic and financial health of a company or market. This approach is especially vital for those interested in long-term trading strategies, as it provides insights into whether an asset is undervalued or overvalued based on its intrinsic value.
Fundamental analysis involves evaluating a variety of factors, including economic indicators, company performance, and overall market conditions. By understanding these elements, traders can make informed decisions that align with their investment goals. For instance, economic indicators such as Gross Domestic Product (GDP) and unemployment rates can signal the health of an economy and influence market sentiment. When GDP is rising, it often indicates a robust economy, which can lead to increased consumer spending and investment, ultimately benefiting the stock market.
On the other hand, company performance is equally crucial. Traders should analyze a company's financial statements, including its income statement, balance sheet, and cash flow statement. Key metrics such as earnings per share (EPS) and revenue growth can provide a snapshot of a company's profitability and operational efficiency. For example, if a company consistently reports increasing EPS, it may indicate strong management and a competitive position in the market. This can be a green flag for traders looking to invest in stocks with solid growth potential.
To illustrate the significance of fundamental analysis, consider the following table that outlines key economic indicators and their implications for trading strategies:
| Economic Indicator | Implication for Traders |
|---|---|
| Gross Domestic Product (GDP) | Rising GDP suggests economic growth, potentially leading to bullish market sentiment. |
| Unemployment Rate | A declining unemployment rate indicates a strengthening economy, which can positively influence stock prices. |
| Interest Rates | Lower interest rates can stimulate borrowing and investing, often leading to higher stock prices. |
| Inflation Rate | High inflation can erode purchasing power, potentially leading to bearish market conditions. |
Incorporating fundamental analysis into your trading strategy can greatly enhance your decision-making process. However, it’s important to remember that while this analysis provides valuable insights, it should not be the sole factor in your trading decisions. Market sentiment, geopolitical events, and even technical analysis can all play significant roles in determining market direction.
As you embark on your trading journey, consider developing a comprehensive trading plan that integrates both fundamental and technical analysis. This holistic approach can help you navigate the markets with greater confidence and improve your chances of success. Remember, trading is not just about numbers; it’s about understanding the story behind those numbers and how they relate to the broader economic landscape.
- What is fundamental analysis? Fundamental analysis is a method of evaluating a security by examining economic indicators, company performance, and market conditions to determine its intrinsic value.
- Why is fundamental analysis important for traders? It helps traders make informed decisions based on the underlying health of an asset, allowing for more strategic long-term investments.
- How do economic indicators impact trading? Economic indicators provide insights into the overall health of the economy, influencing market sentiment and asset prices.
- Can fundamental analysis be used for short-term trading? While it is primarily used for long-term strategies, some traders may incorporate fundamental analysis for short-term trades based on news events or earnings reports.

Economic Indicators
When it comes to trading, understanding is like having a roadmap that guides you through the complex landscape of financial markets. These indicators are essential tools that provide traders with insights into the overall health of the economy. They can significantly influence market trends, making it crucial for traders to stay informed about them. Think of economic indicators as the pulse of the economy; they reflect the current state and can hint at future movements. Some of the most significant indicators include Gross Domestic Product (GDP), unemployment rates, and inflation rates.
The Gross Domestic Product (GDP) measures the total economic output of a country. A rising GDP usually indicates a healthy economy, which can lead to increased consumer spending and investment. Conversely, a declining GDP can signal economic trouble, prompting traders to adjust their strategies accordingly. For instance, if GDP growth is slowing, traders might anticipate a downturn in the stock market and consider protective measures.
Another critical indicator is the unemployment rate. A low unemployment rate typically signifies a strong economy where jobs are plentiful, leading to increased consumer confidence and spending. On the other hand, a high unemployment rate can indicate economic distress, which may cause traders to become more cautious. It's essential to monitor trends in unemployment, as sudden spikes can have immediate effects on market sentiment.
Inflation rates also play a vital role in economic analysis. Moderate inflation is often a sign of a growing economy, but when inflation rises too quickly, it can erode purchasing power and impact interest rates. Traders need to be aware of inflation trends because they can influence central bank policies, which in turn affect currency values and stock prices.
To summarize, here are some key economic indicators that traders should keep an eye on:
- Gross Domestic Product (GDP): Indicates economic growth.
- Unemployment Rate: Reflects job market health.
- Inflation Rate: Affects purchasing power and monetary policy.
By understanding these indicators, traders can make more informed decisions and adjust their trading strategies to align with market conditions. Economic indicators serve as a compass, helping traders navigate through uncertainty and volatility in the financial markets.
Q: Why are economic indicators important for traders?
A: Economic indicators provide crucial insights into the health of the economy, helping traders anticipate market movements and make informed decisions.
Q: How often are economic indicators released?
A: Economic indicators are released on a regular schedule, with some being monthly, quarterly, or annually, depending on the specific indicator.
Q: Can economic indicators predict market trends?
A: While economic indicators can provide valuable insights, they are not foolproof predictors. Traders should use them in conjunction with other analysis methods.

Company Financials
When it comes to trading stocks, understanding is like having a treasure map. It guides traders through the complex landscape of investment opportunities, helping them to uncover hidden gems and avoid potential pitfalls. Company financials primarily consist of key metrics that reflect a company's performance and health, such as earnings per share (EPS), revenue, debt levels, and cash flow. By analyzing these figures, traders can make more informed decisions about whether to buy, hold, or sell a particular stock.
One of the most critical components of company financials is the income statement. This document provides a snapshot of a company's profitability over a specific period, detailing how much money the company earned and what it spent. For instance, if a company reports a rising EPS, it indicates that the company is becoming more profitable, which can attract investors. Conversely, a declining EPS may raise red flags, prompting traders to reconsider their positions.
Furthermore, the balance sheet offers insights into a company's financial stability by showcasing its assets, liabilities, and shareholders' equity. A strong balance sheet typically features a healthy ratio of assets to liabilities, indicating that the company can meet its financial obligations. Traders often look for companies with low debt levels, as high debt can pose significant risks, especially during economic downturns.
Additionally, cash flow statements reveal the actual cash generated or used by a company during a specific period. Positive cash flow is crucial for a company's operations, as it indicates that the business can fund its activities, pay dividends, and invest in growth opportunities. Traders should be cautious of companies with negative cash flow, as it may signal underlying issues that could affect stock performance.
To illustrate the importance of these financial metrics, consider the following table that summarizes key financial indicators of two hypothetical companies:
| Company | Earnings Per Share (EPS) | Revenue | Debt-to-Equity Ratio | Cash Flow |
|---|---|---|---|---|
| Company A | $3.50 | $1.2 Billion | 0.5 | $150 Million |
| Company B | $1.20 | $800 Million | 2.0 | -$50 Million |
In this example, Company A demonstrates strong financial health with a high EPS, substantial revenue, a low debt-to-equity ratio, and positive cash flow. On the other hand, Company B's high debt-to-equity ratio and negative cash flow might raise concerns for traders. This comparison highlights how critical it is to evaluate company financials before making trading decisions.
Ultimately, analyzing company financials is not just about crunching numbers; it’s about storytelling. Each metric tells a part of the company's story, and as traders, we need to piece together that narrative to forecast potential future performance. By incorporating financial analysis into your trading strategy, you can enhance your decision-making process and align your investments with your financial goals.
- What is the most important financial metric to consider? While it varies by industry, many traders prioritize earnings per share (EPS) as a key indicator of profitability.
- How often should I review a company's financials? It's wise to review financial statements quarterly, especially around earnings reports, to stay updated on performance trends.
- Can financials predict stock price movements? While they provide valuable insights, stock prices are influenced by various factors, including market sentiment and economic conditions.

Risk Management Techniques
Effective risk management is the backbone of successful trading. It’s like having a safety net while walking a tightrope; without it, one misstep can lead to a significant fall. Traders must understand that while the allure of profits is enticing, the potential for losses is ever-present. Therefore, developing robust risk management techniques is not just advisable; it’s essential for long-term sustainability in the financial markets.
One of the primary techniques in risk management is position sizing. This refers to determining how much capital to allocate to each trade based on your overall portfolio size and your risk tolerance. Think of it as portion control in a diet; just as you wouldn’t want to overindulge and regret it later, in trading, you wouldn’t want to risk too much of your capital on a single trade. A common method for calculating position size is the fixed percentage method, where you risk a specific percentage of your total capital on each trade. For instance, if your trading account has $10,000 and you decide to risk 2% per trade, your maximum risk would be $200. This ensures that even a series of losses won’t deplete your account.
Another critical aspect of risk management is the use of stop-loss orders. These are pre-set orders that automatically sell your position when it reaches a certain price, helping to limit your losses. Imagine you’re driving a car; a stop-loss order acts like your brakes, allowing you to stop before you crash. To set effective stop-loss levels, traders often consider volatility and support/resistance levels. For example, if you’re buying a stock that has been fluctuating between $50 and $60, placing a stop-loss order at $48 might be prudent, as it allows for some volatility while protecting your capital from larger losses.
In addition to these techniques, it's crucial to continuously assess your risk management strategies. The financial markets are dynamic, and what works today might not work tomorrow. Regularly reviewing your trades and outcomes can help you identify patterns and adjust your strategies accordingly. You might even consider maintaining a trading journal to document your trades, the rationale behind your decisions, and the outcomes. This can be invaluable for learning from both successes and mistakes.
Here’s a simple table summarizing the key risk management techniques:
| Technique | Description | Benefits |
|---|---|---|
| Position Sizing | Determining how much capital to risk on each trade. | Protects against large losses, maintains portfolio balance. |
| Stop-Loss Orders | Automatic sell orders to limit losses at a predetermined price. | Helps to control losses and manage emotional trading decisions. |
| Trade Journal | A record of trades, decisions, and outcomes. | Facilitates learning from past trades and improving strategies. |
In conclusion, risk management techniques are not just a safety measure; they are a trader’s best friend. By implementing effective strategies such as position sizing and stop-loss orders, you can navigate the unpredictable waters of trading with confidence. Remember, it’s not about avoiding losses entirely; it’s about managing them wisely so that you can continue to trade another day.
- What is the most important aspect of risk management? The most crucial aspect is understanding your risk tolerance and applying techniques like position sizing and stop-loss orders to protect your capital.
- How do I determine my position size? You can calculate your position size by risking a fixed percentage of your total capital on each trade, adjusting based on your risk tolerance.
- Can I adjust my stop-loss orders after placing them? Yes, you can adjust your stop-loss orders as the market moves, but it’s important to ensure that you maintain your risk management strategy.

Position Sizing
When it comes to trading, one of the most crucial aspects that can make or break your success is . This term refers to the amount of capital you allocate to a particular trade, and it directly impacts your risk exposure and potential profit. Think of it as the foundation of your trading strategy; without a solid base, everything else can crumble. A well-thought-out position sizing strategy allows you to manage your risk effectively while maximizing your potential returns.
To determine the right position size, traders often consider several factors, including their risk tolerance, the size of their trading account, and the specific trade setup. A common method is the percentage risk model, where traders decide to risk a certain percentage of their total capital on a single trade. For example, if you have a trading account of $10,000 and decide to risk 2% per trade, you would only risk $200. This approach helps to protect your account from significant losses and allows you to continue trading even during losing streaks.
Another popular approach is the fixed dollar amount model, where traders allocate a fixed dollar amount to each trade regardless of their capital size. While this method is straightforward, it may not account for the varying levels of risk associated with different trades. Therefore, many traders find the percentage risk model to be more effective in adapting to their changing account balance and risk profile.
Here's a simple table that illustrates how different position sizes can affect your potential losses based on your risk tolerance:
| Account Balance | Risk Percentage | Risk Amount | Position Size (Assuming $10 Risk per Share) |
|---|---|---|---|
| $10,000 | 1% | $100 | 10 shares |
| $10,000 | 2% | $200 | 20 shares |
| $10,000 | 5% | $500 | 50 shares |
As you can see, the position size increases as the risk percentage rises, which means your exposure to loss also increases. Therefore, it's essential to find a balance that aligns with your trading goals and psychological comfort level. Remember, the goal is not only to make profits but also to protect your capital.
Moreover, the concept of dynamic position sizing is gaining traction among traders. This approach involves adjusting your position size based on your current account balance and the volatility of the market. For instance, during high volatility periods, you might choose to reduce your position size to mitigate risk, while in calmer market conditions, you could increase it. This adaptability can be a game-changer in maintaining a sustainable trading strategy.
In conclusion, mastering position sizing is vital for any trader looking to achieve long-term success. It requires a blend of discipline, strategy, and self-awareness. By carefully considering your risk tolerance and employing effective position sizing techniques, you can enhance your trading performance and navigate the financial markets with confidence.
- What is the best position sizing method? The best method varies by trader. Many prefer the percentage risk model for its adaptability to changing account balances.
- How often should I adjust my position size? Adjust your position size based on your account balance and market volatility. Regular reviews can help optimize your strategy.
- Can position sizing help reduce losses? Yes, effective position sizing can limit your exposure to losses and protect your trading capital.

Stop-Loss Orders
When it comes to trading, one of the most effective tools in a trader's arsenal is the stop-loss order. This simple yet powerful mechanism acts like a safety net, designed to protect your investments from significant losses during volatile market conditions. Imagine you're on a roller coaster; a stop-loss order is like the harness that keeps you secure, ensuring you don't plummet down unexpectedly. By setting a specific price at which your position will be automatically sold, you can limit your losses and avoid emotional decision-making during chaotic market swings.
So, how do stop-loss orders actually work? Essentially, you instruct your broker to sell a security when it reaches a predetermined price. For instance, if you purchase a stock at $50, you might set a stop-loss order at $45. If the stock price dips to $45, your broker will execute the sale, thus limiting your loss to $5 per share. This strategy not only helps in managing risk but also allows traders to maintain a disciplined approach to trading.
However, it's crucial to understand that stop-loss orders are not foolproof. In highly volatile markets, prices can "gap" past your stop-loss level, leading to a sale at a much lower price than expected. This phenomenon is often referred to as slippage. Therefore, understanding the market conditions and setting your stop-loss orders wisely is vital. Traders often use different types of stop-loss orders, such as:
- Standard Stop-Loss: A fixed price at which the order is executed.
- Trailing Stop-Loss: This moves with the market price, allowing you to lock in profits while still protecting against losses.
- Guaranteed Stop-Loss: This ensures that your order is executed at the specified price, regardless of market fluctuations.
Another essential aspect to consider is the placement of your stop-loss order. It’s not just about picking a number; it’s about analyzing the market and understanding the asset's volatility. A common mistake is placing the stop-loss too close to the market price, which could trigger a sale during normal market fluctuations. Instead, consider placing it based on technical analysis, such as support and resistance levels, to give your trade some breathing room.
In summary, stop-loss orders are a vital component of a solid trading strategy. They not only help you manage risk but also instill a sense of discipline in your trading approach. By understanding how to effectively implement and adjust your stop-loss orders, you can navigate the unpredictable waters of trading with greater confidence and control.
Q: What is a stop-loss order?
A: A stop-loss order is an instruction to sell a security when it reaches a specified price, helping to limit potential losses.
Q: Can a stop-loss order guarantee that I won't lose money?
A: No, while stop-loss orders help manage risk, they do not guarantee against losses, especially in volatile markets where slippage can occur.
Q: How should I set my stop-loss level?
A: It's advisable to set your stop-loss based on market analysis, considering support and resistance levels, rather than just a fixed percentage.
Q: What is a trailing stop-loss?
A: A trailing stop-loss is a dynamic order that adjusts with the market price, allowing you to secure profits while still protecting against losses.

Backtesting Strategies
Backtesting is a crucial step in the trading strategy development process. It involves testing a trading strategy on historical data to evaluate its effectiveness before applying it in real-time markets. Think of it as a rehearsal before the big performance; you want to ensure everything runs smoothly before the spotlight is on you. By simulating trades based on past market conditions, traders can gain valuable insights into how their strategies would have performed, allowing for adjustments and refinements. This process not only helps in validating the strategy but also builds confidence in the trader's approach.
One of the most significant aspects of backtesting is the choice of historical data. Selecting the right data can make or break the backtesting process. Traders must consider the following factors while choosing data:
- Timeframe: The period over which the strategy will be tested should be long enough to encompass various market conditions.
- Data Quality: Ensure the data is accurate and free from errors, as inaccurate data can lead to misleading results.
- Market Conditions: The historical data should reflect different market environments, including bullish, bearish, and sideways trends.
Once the right data is selected, the next step is to interpret the backtest results. Understanding these results is key to evaluating the strategy's viability. Traders should focus on several key metrics:
| Metric | Description |
|---|---|
| Win Rate | The percentage of profitable trades compared to total trades. A higher win rate indicates a potentially successful strategy. |
| Drawdown | The maximum observed loss from a peak to a trough before a new peak is achieved. It helps assess risk and potential losses. |
| Profit Factor | The ratio of gross profit to gross loss. A profit factor greater than 1 indicates that the strategy is profitable. |
By analyzing these metrics, traders can make informed decisions about whether to proceed with their strategy or make necessary adjustments. For instance, a low win rate might prompt a trader to tweak their entry or exit criteria, while a significant drawdown could indicate a need for better risk management techniques.
Moreover, backtesting is not just about looking at numbers; it's about understanding the story behind them. Traders should consider the context of the trades and how external factors, such as economic events or market news, could have influenced the results. This holistic approach helps in refining strategies to be more robust and adaptable to future market conditions.
What is backtesting?
Backtesting is the process of testing a trading strategy using historical data to determine its effectiveness before applying it in real-time trading.
Why is backtesting important?
Backtesting allows traders to validate their strategies, build confidence, and make necessary adjustments based on how the strategy would have performed in the past.
How do I choose the right data for backtesting?
Select data that is accurate, covers a significant timeframe, and reflects various market conditions to ensure reliable backtest results.
What metrics should I focus on when interpreting backtest results?
Key metrics include win rate, drawdown, and profit factor, which provide insights into the strategy's performance and risk.

Choosing the Right Data
When it comes to backtesting trading strategies, selecting the right data is absolutely crucial. Think of it like preparing a recipe; if you don’t have the right ingredients, the dish won’t turn out as expected. In trading, the quality and type of data you use can significantly impact the reliability of your backtest results. So, what should you look for when choosing your data?
First and foremost, you need to ensure that the data is historically accurate. This means sourcing data from reputable providers who maintain high standards for accuracy and completeness. If your data is riddled with errors or inconsistencies, your backtesting results will likely lead you astray. Make it a habit to check the data for anomalies or gaps that could skew your analysis.
Next, consider the timeframe you plan to trade in. Are you a day trader looking for minute-by-minute data, or are you more of a swing trader who relies on daily or weekly data? Each trading style requires different types of data. For instance, high-frequency traders need tick data, which records every single transaction, while long-term investors might only need end-of-day prices. Make sure you align your data selection with your trading strategy to ensure relevancy.
Additionally, the type of data matters. You can choose between various forms of data, such as:
- Price Data: Open, high, low, close (OHLC) prices are fundamental for technical analysis.
- Volume Data: Understanding how much of an asset is being traded can provide insights into market strength.
- Fundamental Data: For those employing a fundamental analysis approach, financial statements and economic indicators are key.
Moreover, consider the frequency of the data updates. If you are trading in a fast-moving market, real-time data can be a game-changer. However, for backtesting, historical data is often more relevant. Look for data that is updated frequently enough to capture market volatility without overwhelming your analysis.
Lastly, don’t overlook the importance of data integrity. Ensure that the data source you choose has a good reputation and provides consistent updates. You wouldn’t want to base your trading decisions on data that is outdated or has been manipulated. Always look for sources that offer transparent methodologies and have a track record of reliability.
In summary, choosing the right data for backtesting is a multi-faceted process that requires careful consideration. By focusing on accuracy, timeframe, type, frequency, and integrity, you can significantly enhance the quality of your backtesting results. Remember, in the world of trading, the right data can be the difference between success and failure!
- What is backtesting? Backtesting is the process of testing a trading strategy on historical data to evaluate its effectiveness.
- Why is data quality important in backtesting? Poor-quality data can lead to inaccurate results, which may misguide trading decisions.
- What types of data should I use for backtesting? Use price data, volume data, and, if applicable, fundamental data relevant to your trading strategy.
- How often should I update my data? It depends on your trading style; day traders may need real-time data, while long-term traders may only need daily updates.

Interpreting Backtest Results
When it comes to trading, backtesting is like a time machine for your strategies. It allows you to travel back and see how your trading plan would have performed in past market conditions. However, interpreting these results is where the magic truly happens. It’s not just about numbers; it’s about understanding what those numbers mean for your future trading decisions. So, how do you go from raw data to actionable insights?
First off, you need to consider the win rate. This metric tells you the percentage of trades that were profitable. A high win rate might seem appealing, but it’s essential to look at it in context. For instance, a strategy with a 70% win rate might sound great, but if the losing trades are significantly larger than the winning ones, you could still end up losing money overall. It’s crucial to analyze the risk-to-reward ratio as well, which compares the potential profit of a trade to its potential loss. A good rule of thumb is to aim for a ratio of at least 2:1, meaning that for every dollar you risk, you aim to make two dollars.
Another vital aspect to consider is the maximum drawdown, which measures the largest peak-to-trough decline in your account balance during the backtesting period. This number can be a real eye-opener, as it shows the worst-case scenario you might face. If your strategy has a high drawdown, it might not be suitable for your risk tolerance, even if the overall returns look promising. Think of it like climbing a mountain; if the path is too steep and risky, you might want to find a safer route.
Additionally, it’s important to analyze the Sharpe ratio, which adjusts your returns for the risk taken. A higher Sharpe ratio indicates that you’re earning more return per unit of risk. This metric can help you compare different strategies on a level playing field. If you find two strategies with similar returns, the one with the higher Sharpe ratio is generally the better choice.
Lastly, don't forget about the time frame of your backtesting. Strategies that work well in one market condition might not perform the same way in another. For example, a strategy that thrived during a bull market may struggle in a bear market. Therefore, it’s wise to test your strategy across multiple time frames and market conditions to get a comprehensive understanding of its viability.
In summary, interpreting backtest results is not just about looking at a few numbers; it’s about understanding the story those numbers tell. By focusing on metrics like win rate, risk-to-reward ratio, maximum drawdown, and the Sharpe ratio, you can gain invaluable insights into your trading strategy's effectiveness. Remember, the goal is to find a balance between risk and reward that aligns with your trading style and personal goals.
- What is backtesting? Backtesting is the process of testing a trading strategy on historical data to see how it would have performed in the past.
- Why is interpreting backtest results important? It helps traders understand the potential effectiveness of their strategies and make informed decisions for future trades.
- What should I look for in backtest results? Focus on metrics like win rate, risk-to-reward ratio, maximum drawdown, and the Sharpe ratio.
- Can I rely solely on backtesting for my trading strategy? While backtesting is a valuable tool, it's essential to combine it with forward testing and a solid understanding of market conditions.
Psychology of Trading
The is an often overlooked yet crucial element that can significantly influence a trader's performance. Imagine stepping into a high-stakes poker game; your emotions can either be your best friend or your worst enemy. In trading, just like in poker, emotions such as fear, greed, and anxiety can lead to impulsive decisions that may jeopardize your financial goals. Understanding these psychological factors is essential for developing a disciplined trading approach.
One of the key aspects of trading psychology is emotional discipline. This means maintaining control over your emotions during trading sessions, especially when markets are volatile. A trader who lets fear dictate their actions might sell off a promising asset at the first sign of a downturn, while one driven by greed may hold onto a losing position in hopes of a miraculous recovery. Both scenarios can lead to devastating losses. To cultivate emotional discipline, traders can implement several strategies:
- Set Clear Goals: Define what you aim to achieve with your trading. This can help you stay focused and avoid emotional reactions.
- Practice Mindfulness: Engage in mindfulness techniques to stay present and reduce anxiety during trading.
- Keep a Trading Journal: Document your trades and emotions to identify patterns that may lead to poor decisions.
Another essential component of trading psychology is the development of a trading plan. A well-structured trading plan acts as a roadmap, guiding you through the complexities of the market. It should incorporate your trading strategies, risk management techniques, and psychological considerations. Think of it as your personal set of rules that keeps you grounded, especially when emotions run high. A solid trading plan typically includes:
| Element | Description |
|---|---|
| Trading Strategy | Clearly outline your approach, whether it's technical analysis, fundamental analysis, or a combination of both. |
| Risk Management | Define how much capital you are willing to risk on each trade and set stop-loss levels accordingly. |
| Performance Review | Regularly assess your trades to understand what works and what doesn't, adjusting your plan as needed. |
Lastly, traders must recognize the importance of self-awareness. Being aware of your emotional state can help you make more rational decisions. For example, if you notice that you’re feeling overly anxious or euphoric, it might be time to step back and reassess your strategy. Just as athletes visualize their performance, traders can benefit from visualizing their trading scenarios to prepare for various outcomes. This mental rehearsal can bolster confidence and reduce the impact of negative emotions.
In conclusion, the psychology of trading is a multifaceted domain that requires attention and practice. By developing emotional discipline, creating a solid trading plan, and fostering self-awareness, traders can enhance their performance and navigate the unpredictable waters of the financial markets with greater confidence and success.
- What is trading psychology? Trading psychology refers to the emotional and mental aspects that influence a trader's decisions and performance.
- Why is emotional discipline important? Emotional discipline helps traders avoid impulsive decisions driven by fear or greed, which can lead to significant losses.
- How can I develop a trading plan? A trading plan should include your trading strategies, risk management techniques, and psychological considerations tailored to your goals.

Emotional Discipline
In the high-stakes world of trading, emotional discipline is like the unsung hero that can make or break a trader's success. Have you ever found yourself staring at a screen, heart racing, as you watch your investments fluctuate? It's all too easy to let emotions take the wheel during these moments. That's why cultivating emotional discipline is crucial. It helps you stick to your trading plan, make rational decisions, and avoid the pitfalls of impulsive trading.
Imagine trading as a roller coaster ride—thrilling yet unpredictable. Just like a roller coaster, the market has its ups and downs, and your emotions can swing just as wildly. When you feel elated after a winning trade, it's tempting to chase that high by taking unnecessary risks. Conversely, after a loss, despair can lead to hasty decisions to recover losses, often resulting in further setbacks. This emotional roller coaster can derail even the most well-thought-out strategies.
So, how do you maintain emotional discipline? It starts with understanding your emotions and recognizing their impact on your trading decisions. Here are a few strategies to help you manage your emotions:
- Set Clear Goals: Establish specific, measurable, achievable, relevant, and time-bound (SMART) goals. This clarity can keep you focused and less swayed by emotions.
- Keep a Trading Journal: Documenting your trades, including your thoughts and feelings during each trade, can provide insights into your emotional triggers and help you learn from past mistakes.
- Practice Mindfulness: Techniques such as meditation or deep-breathing exercises can help you stay calm and centered, allowing you to make more rational decisions.
Another essential aspect of emotional discipline is developing a robust trading plan. A well-structured plan acts as your roadmap through the turbulent market landscape. It should outline your trading strategies, risk management techniques, and the emotional triggers you need to watch out for. By adhering to your plan, you create a framework that minimizes the influence of emotions on your trading decisions.
Moreover, it’s vital to accept that losses are part of the trading game. Every trader, no matter how experienced, faces losses. Embracing this reality can help you develop resilience and avoid the emotional turmoil that often follows a losing trade. When a loss occurs, rather than reacting impulsively, take a step back, analyze what went wrong, and adjust your strategy accordingly.
In summary, emotional discipline is not just about controlling your feelings; it's about creating a mental environment where rational decision-making thrives. By practicing mindfulness, maintaining a trading journal, and adhering to a well-defined trading plan, you can significantly enhance your emotional discipline. Remember, the market is a reflection of human behavior, and mastering your emotions can lead to a more successful trading journey.
1. What is emotional discipline in trading?
Emotional discipline refers to the ability to manage your emotions and make rational decisions while trading. It helps traders stick to their plans and avoid impulsive actions driven by fear or greed.
2. How can I improve my emotional discipline?
You can improve emotional discipline by setting clear trading goals, keeping a trading journal, practicing mindfulness, and developing a comprehensive trading plan that includes risk management strategies.
3. Why is emotional discipline important in trading?
Emotional discipline is crucial because it helps traders make informed decisions, reduces the likelihood of impulsive trading, and ultimately leads to better trading outcomes.
4. What should I do after a losing trade?
After a losing trade, take a moment to analyze what went wrong rather than reacting impulsively. Review your trading plan and adjust your strategy if necessary, but avoid making hasty decisions based on emotions.

Developing a Trading Plan
Creating a trading plan is like crafting a roadmap for your financial journey. Without it, you might find yourself lost in the chaotic world of trading, where emotions can cloud your judgment and lead to costly mistakes. A well-structured trading plan not only outlines your strategies but also acts as a guiding principle to keep you focused on your goals. So, how do you go about developing one? Let's dive into the essential components that should be included in your trading plan.
First and foremost, you need to define your trading goals. Are you looking for short-term gains, or are you in it for the long haul? Understanding your objectives will help shape your trading strategies and risk tolerance. For instance, if you're aiming for quick profits, your approach will differ significantly from someone who is focused on long-term investments. Consider setting SMART goals—Specific, Measurable, Achievable, Relevant, and Time-bound—to give your plan a solid foundation.
Next, it's crucial to outline your risk management strategies. This is where you decide how much capital you're willing to risk on each trade. A common rule of thumb is to risk no more than 1-2% of your trading capital on a single trade. This means if you have a $10,000 trading account, you should limit your risk to $100-$200 per trade. By adhering to this principle, you can protect your capital and stay in the game longer, even when the market turns against you.
Another vital aspect of your trading plan is the entry and exit strategies. Clearly define the criteria that will trigger your buy and sell decisions. This could involve technical indicators, chart patterns, or fundamental analysis. For example, you might decide to enter a trade when a stock breaks above its 50-day moving average and exit when it falls below it. By having these rules in place, you can eliminate emotional decision-making and stick to your plan, even when the market is volatile.
Additionally, keep a section for performance evaluation. This is where you track your trades and assess what works and what doesn’t. Regularly reviewing your performance can help you identify patterns in your trading behavior, such as recurring mistakes or successful strategies. You might even consider maintaining a trading journal where you document your trades, the reasoning behind them, and the outcomes. This practice can provide invaluable insights and help you refine your trading plan over time.
Lastly, don’t forget to incorporate psychological considerations. Trading can be an emotional rollercoaster, and how you manage those emotions can significantly impact your success. Include strategies in your plan for maintaining emotional discipline, such as taking breaks during high-stress periods or using mindfulness techniques. Remember, a calm mind leads to clearer decisions.
In summary, developing a comprehensive trading plan involves setting clear goals, outlining risk management strategies, defining entry and exit criteria, evaluating performance, and addressing psychological factors. By taking the time to craft a detailed plan, you can navigate the trading landscape with confidence and increase your chances of success.
- What is the primary purpose of a trading plan?
A trading plan serves as a roadmap for traders, outlining strategies, risk management practices, and goals to guide their trading decisions. - How often should I update my trading plan?
It's advisable to review and update your trading plan regularly, especially after significant market changes or personal trading experiences. - Can I trade without a trading plan?
While it's possible to trade without a plan, doing so increases the risk of emotional decision-making and can lead to poor trading outcomes.
Frequently Asked Questions
- What are trading strategies?
Trading strategies are systematic methods traders use to make decisions in the financial markets. They can be based on various analyses, such as technical or fundamental, and help traders identify potential entry and exit points while managing their risk.
- How do I choose the right trading strategy for me?
Choosing the right trading strategy depends on your personal goals, risk tolerance, and market knowledge. It’s essential to evaluate different strategies, consider your trading style, and possibly backtest them using historical data to see what aligns best with your objectives.
- What is technical analysis and how is it used?
Technical analysis involves evaluating historical price data and using chart patterns, indicators, and trends to predict future market movements. Traders use this analysis to make informed decisions about when to enter or exit trades, often relying on visual tools and statistical metrics.
- What are chart patterns and why are they important?
Chart patterns are formations created by the price movements of a security on a chart. They are important because they can indicate potential future price movements, helping traders to identify trends and reversals, which can be crucial for making timely trading decisions.
- What is fundamental analysis?
Fundamental analysis involves evaluating a company's financial health and overall economic conditions to make trading decisions. This includes analyzing economic indicators like GDP, unemployment rates, and company financial statements to determine the intrinsic value of a stock or asset.
- How can I manage risk in trading?
Risk management is crucial in trading. Techniques such as position sizing, setting stop-loss orders, and diversifying your portfolio can help minimize potential losses. Understanding your risk tolerance and consistently applying these techniques can protect your capital while pursuing profits.
- What is backtesting and why is it important?
Backtesting is the process of testing a trading strategy on historical data to evaluate its effectiveness. It's important because it helps traders refine their strategies, understand potential outcomes, and gain confidence in their approach before applying it to live markets.
- How does psychology affect trading performance?
The psychology of trading significantly impacts performance. Emotions such as fear and greed can lead to impulsive decisions. Maintaining emotional discipline, having a solid trading plan, and developing strategies to manage these emotions are essential for long-term success in trading.


